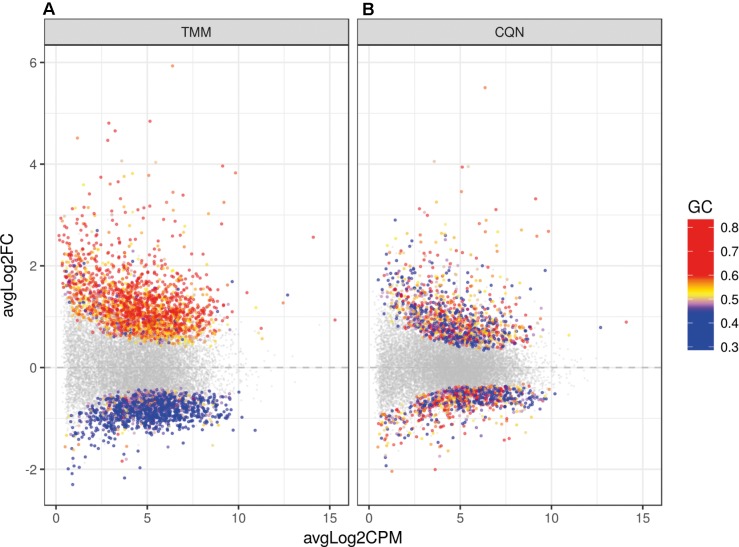
FIGURE 3.
Dot plot of the differentially expressed genes (DEGs) in HCHWA-D samples compared to the control samples with log2 fold change (log2FC) vs. log2 counts per million (log2CPM) (A) without correction and (B) with CQN correction for GC bias. Significant DEGs in both panels are highlighted by colored dots; colors in legend indicate the GC-content.

