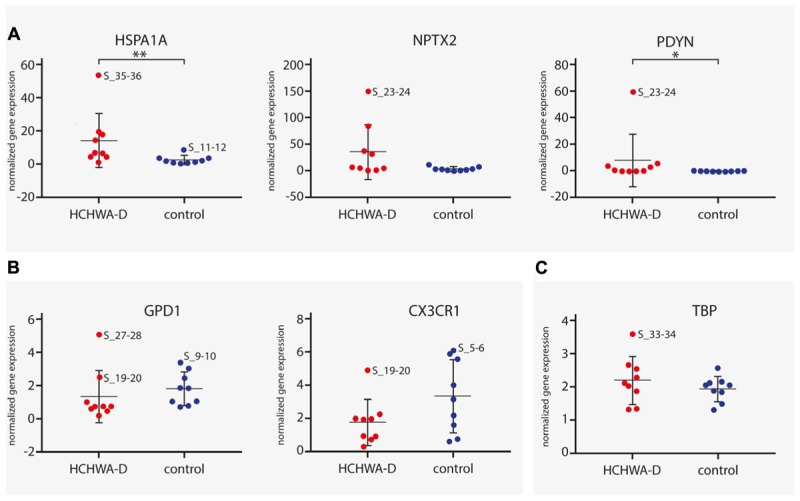
FIGURE 5.

qPCR analysis of (A) three up-regulated genes (HSPA1A, NPTX2, and PDYN) and (B) two down-regulated genes (GPD1 and CX3CR1). Transcript levels of HCHWA-D samples were not following a normal distribution (data not shown). HSPA1A and PDYN were found significantly up-regulated (MW test, p = 0.006∗∗ and p = 0.040∗, respectively). For GPD1, significance was reached upon removal of the greatest outlier (t-test, p = 0.030∗; S_27-28 outlier identified with the ROUT method, Q = 1%; data not shown), no significant outliers found for CX3CR1. Transcript expression levels were normalized with two reference gene, n = 9. (C) TBP normalization control was not significantly different (t-test, p = 0.32). ∗p < 0.05 and ∗∗p < 0.01. RNA-seq samples code are used to identify greatest outlier.
