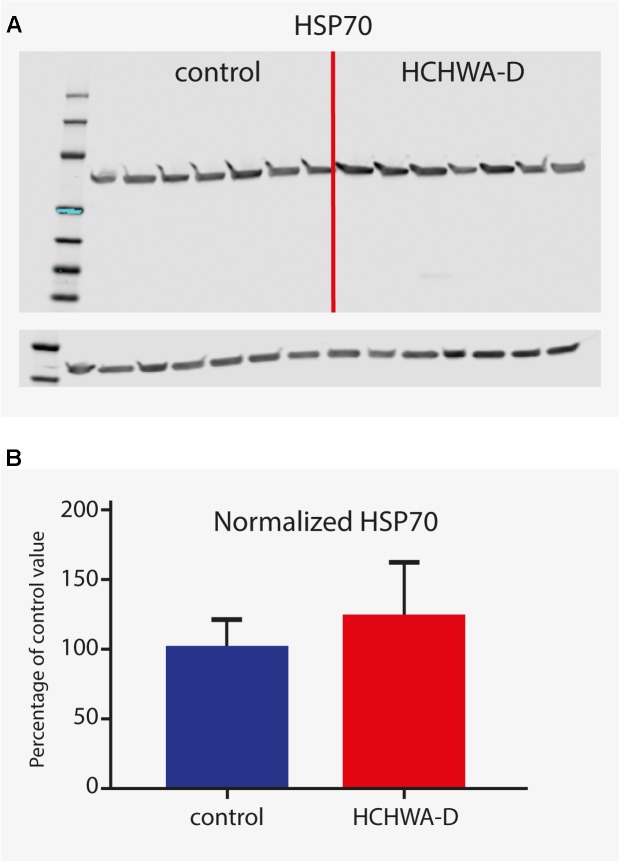
FIGURE 6.
Western blot analysis of HSP70 (antibody detecting HSPA1A and HSPA1B). (A) Signals given by HSP70 antibody showing a band at 70 kDa (with β-actin loading control under main blot). (B) Signal intensity quantification (n = 7, β-actin normalized). Higher protein level in HCHWA-D occipital cortex compared to control occipital cortex was measured although not significantly different; p = 0.1888 with a two-tailed unpaired Student’s t-test.

