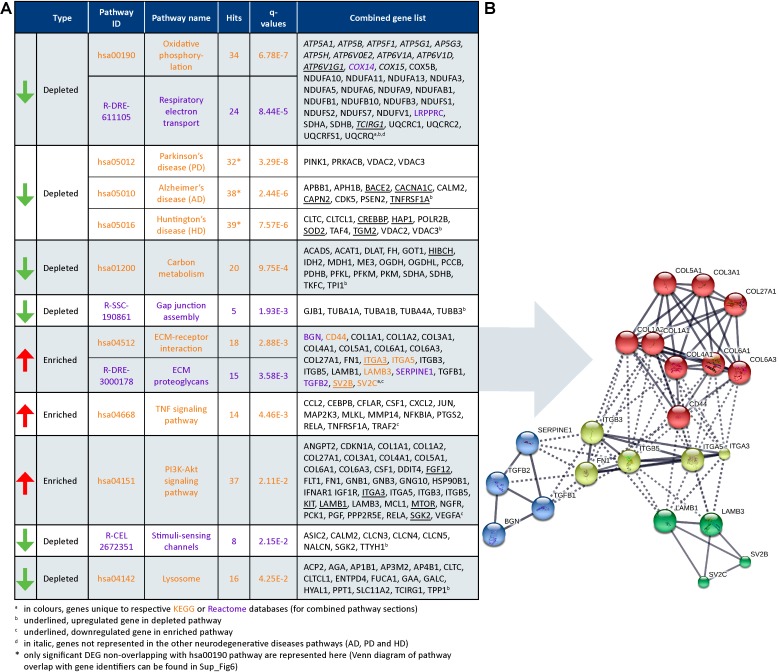
FIGURE 7.
Dysregulated pathways in HCHWA-D. (A) Significantly dysregulated pathways in HCHWA-D DEG subset and associated genes identifiers in GeneTrail2 v1.5 (with fold change input; ranked on statistical significance except for the combined HD, AD, and PD categories). Depleted pathways (green arrows) are over-represented by down-regulated genes and enriched pathways (red arrows) are over-represented by up-regulated genes. Text color codes distinguish pathways originating from KEGG (orange) or Reactome (purple) databases. (B) Schematic representation of known interactions between genes of the ECM-related pathways. Representation of high confidence interactions with MCL clustering in String interaction database (line thickness indicates the strength of data support).

