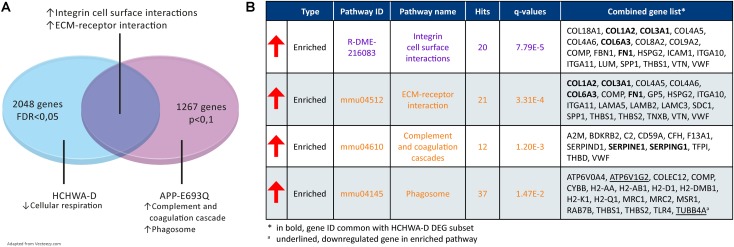
FIGURE 8.
Transcriptome comparison of HCHWA-D and APP-E963Q mouse model (entorhinal cortex; APP-E693Q vs. WT; Readhead et al., 2015). (A) Venn diagram depicting major dysregulations and overlap in enriched pathway. (B) Significantly dysregulated pathways in APP-E693Q DEG subset and associated genes identifiers in GeneTrail2 v1.5 (with fold change input; ranked on statistical significance). Text color codes distinguish pathways originating from KEGG (orange) or Reactome (purple) databases.

