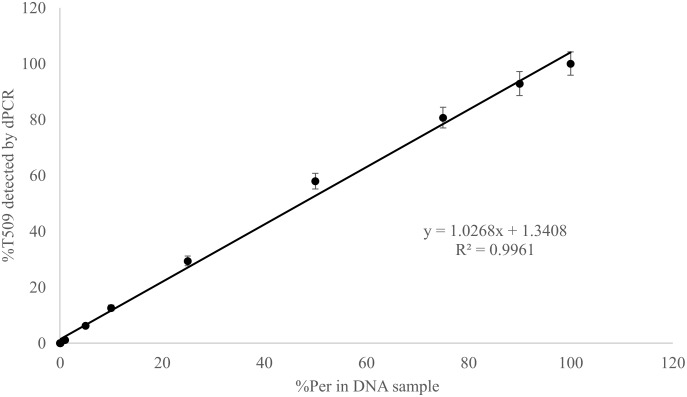
FIGURE 2.
Linear correlation between percent T509 allele in Blumeria graminis f. sp. hordei genomic DNA samples quantified by digital PCR and the percentage of the triazole resistant isolate Per (T509) in a genomic DNA mixture of Per and the triazole sensitive isolate Wagga (S509). Each point represents the average of triplicate chips.

