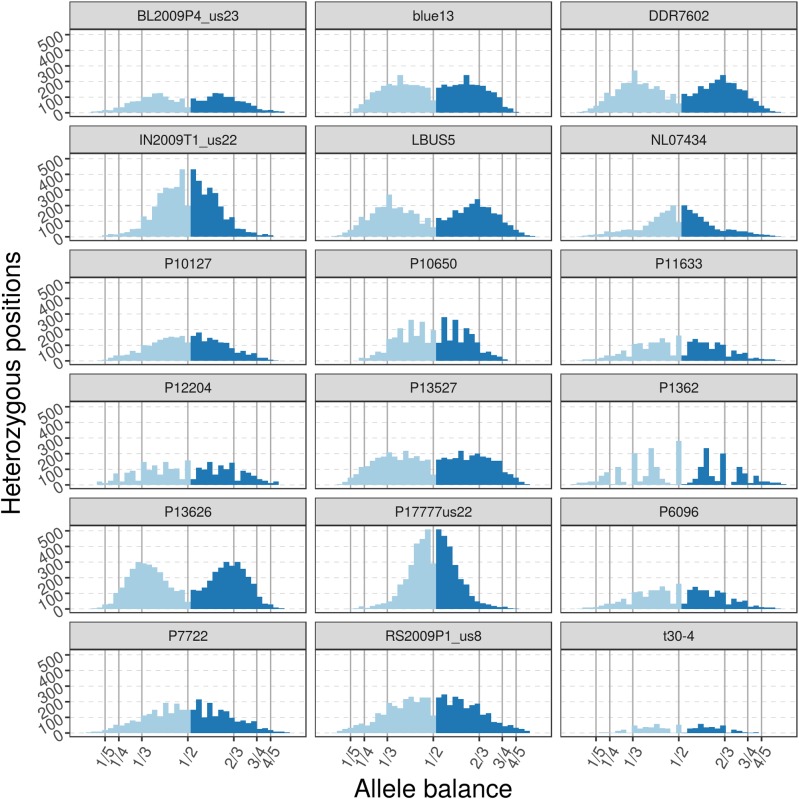
FIGURE 12.
The distribution of allele balance values for variants from supercontig_1.50 of P. infestans. These samples are of a more typical read depth than the other samples presented here. Note that some samples may not have a copy number that is easily determined. This illustrates the importance of providing numerical summaries as well as visualizations for the data that demonstrate edge cases as well as methods to address poor quality (e.g., removal of data based on read depth thresholds).

