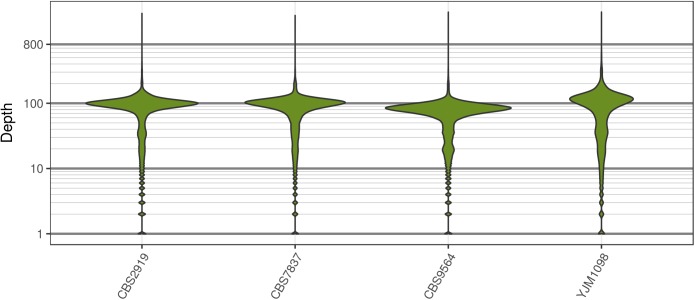
FIGURE 2.
The distribution of sequence depth at variable positions in Saccharomyces cerevisiae. While each genome was sequenced at close to 100X, each genome also had long tails for variants that were sequenced at very high and low coverage. These tails are typically observed for high throughput sequencing data.

