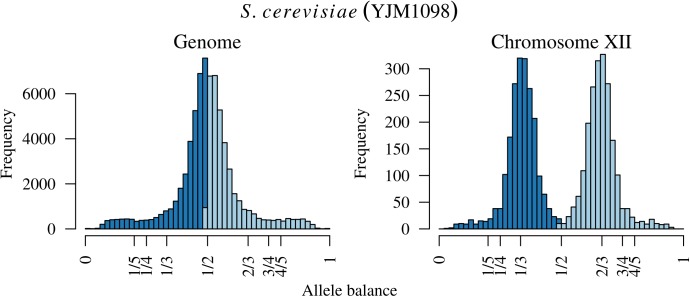
FIGURE 5.
The distribution of allele balance values for an entire sample of Saccharomyces cerevisiae and the distribution for just chromosome XII. Note the y-axis for each plot. The distribution on the right is contained within the distribution of the entire sample on the left so that this variation in copy number is hidden in plain sight.

