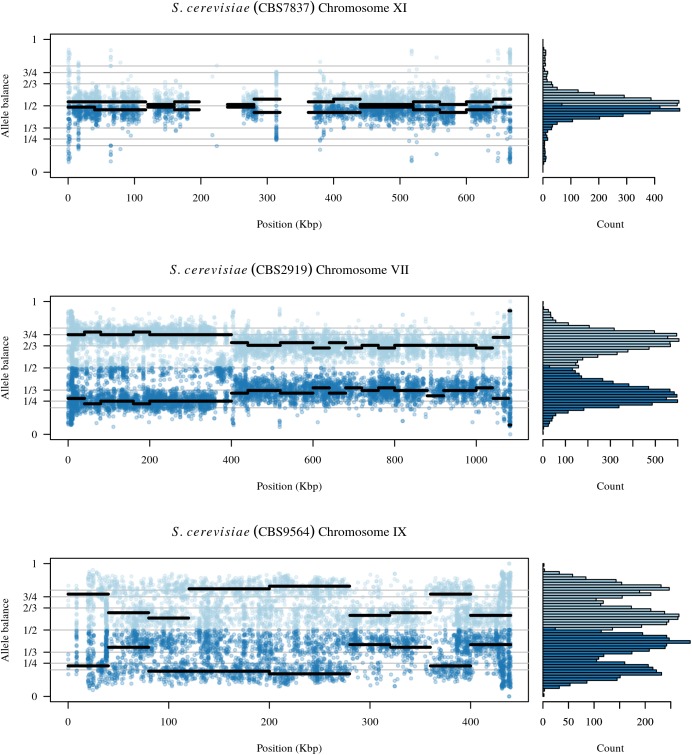
FIGURE 6.
The chromosomal distribution of heterozygous positions and their allele balance. Each plot represents one chromosome. At each variable position along the chromosome there is a pair of dots: a light blue dot above 1/2 and a darker blue dot below 1/2. These dots are the allele balance for each variant. Horizontal lines represent windows where the width is the user specified window size and the elevation is the summarized allele balance for the window. The marginal histogram summarizes the entire chromosome. The top plot is chromosome XI from sample CBS7837 and represents a diploid example. Regions at 230 and 350 kbp are regions that exhibit low levels of heterozygosity and the lack of a horizontal line indicates that these regions were omitted from the results. The middle panel is from chromosome VII of sample CBS2919. This chromosome appears to consist of four copies from its origin to around 400 kbp where it changes to three copies. The bottom panel is chromosome IX from sample CBS9564. This chromosome appears to consist of regions that have three copies as well as regions with five copies.

