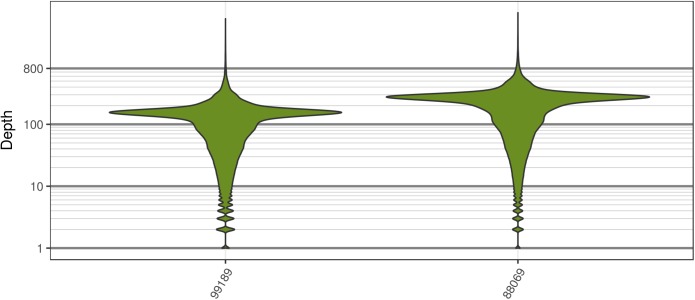
FIGURE 7.
The distribution of sequence depths at variable positions for P. infestans samples produced by Weiß et al. (2018). These plots are similar to the S. cerevisiae plots in that most of the genome appears to have been sequenced at a base ploidy level, but long tails indicate that regions above and below this level exist.

