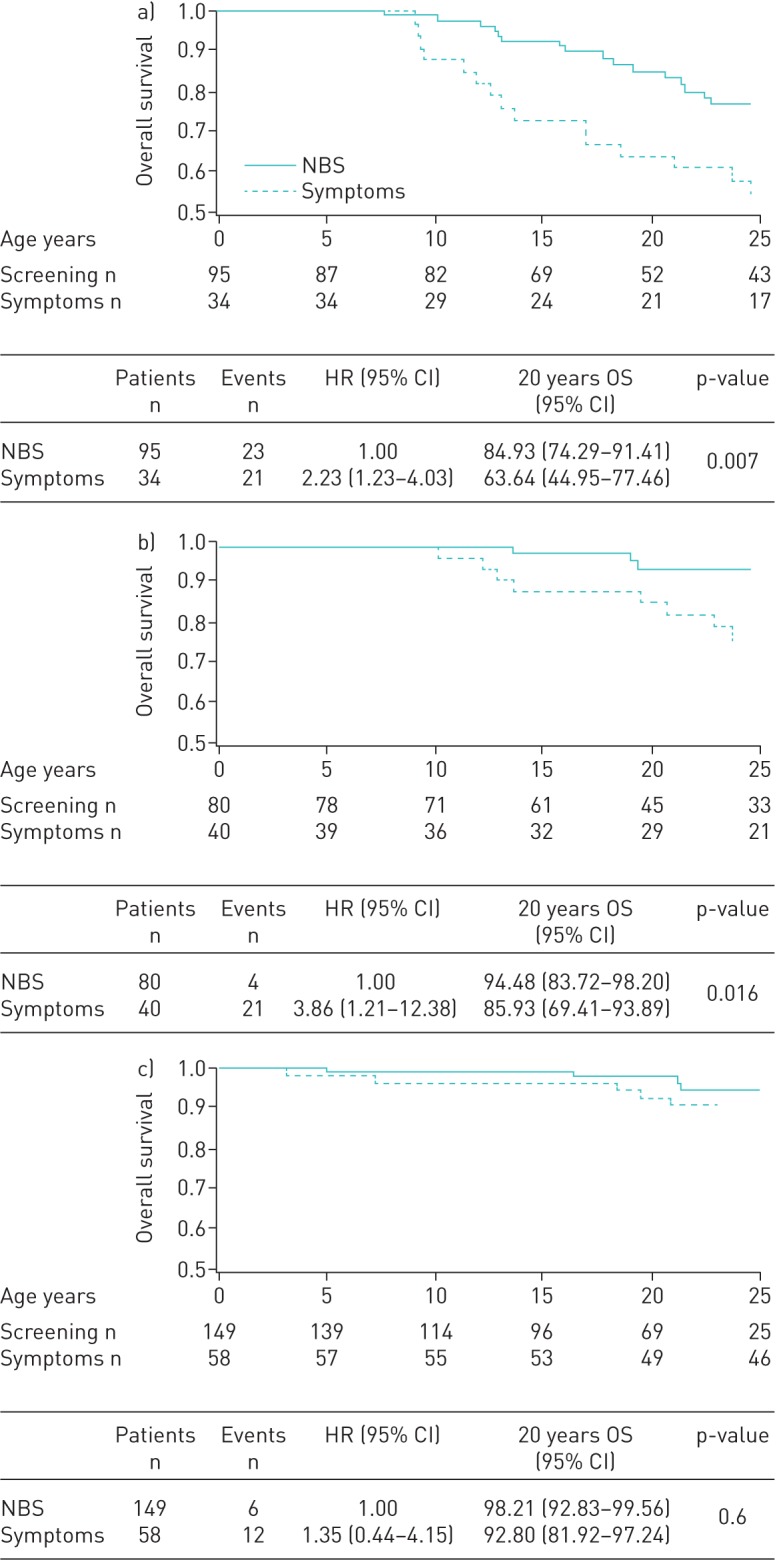
FIGURE 1.

The 20-year overall survival was significantly higher in the newborn screening (NBS) group than in the symptoms group for each of the subgroups defined according to severity. In a) the severe group it was 85% in the NBS versus 64% in the symptoms group (p=0.007); in b) the moderate group it was 94% in the NBS versus 86% in the symptoms group (p=0.016); and in c) the mild group it was 98% in the NBS versus 93% in the symptoms group (p=0.6). Survival probability is presented on a scale from 0.5 to 1.0 for readability. HR: hazard ratio; OS: overall survival.
