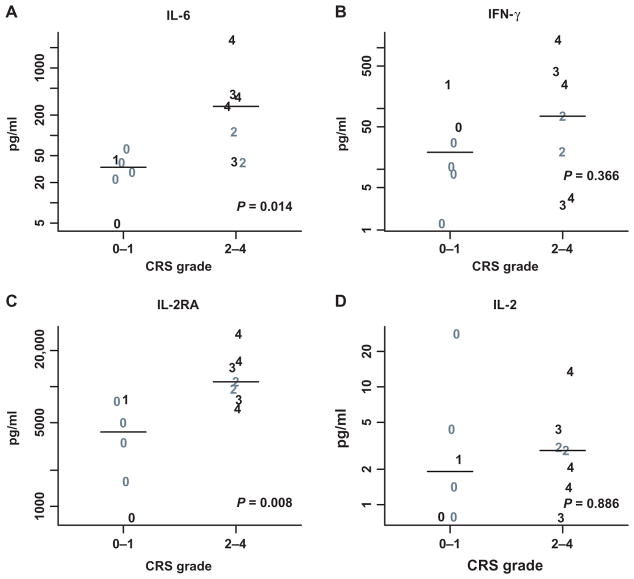
Fig. 5. Peak cytokines values over the first month after infusion.
(A to D) Peak values for IL-6 (A), IFN-γ (B), IL-2 receptor antagonist (IL-2RA) (C), and IL-2 (D) by CRS grades are displayed. Gray symbols represent nonresponders; black symbols are those who achieved a complete or partial remission. Individual values are plotted with a symbol that reflects their CRS grade (1 to 4). Wilcoxon rank-sum P values are also provided. Cytokine values were missing for one grade 4 subject who achieved CR (n = 13). (Source data, table S11).

