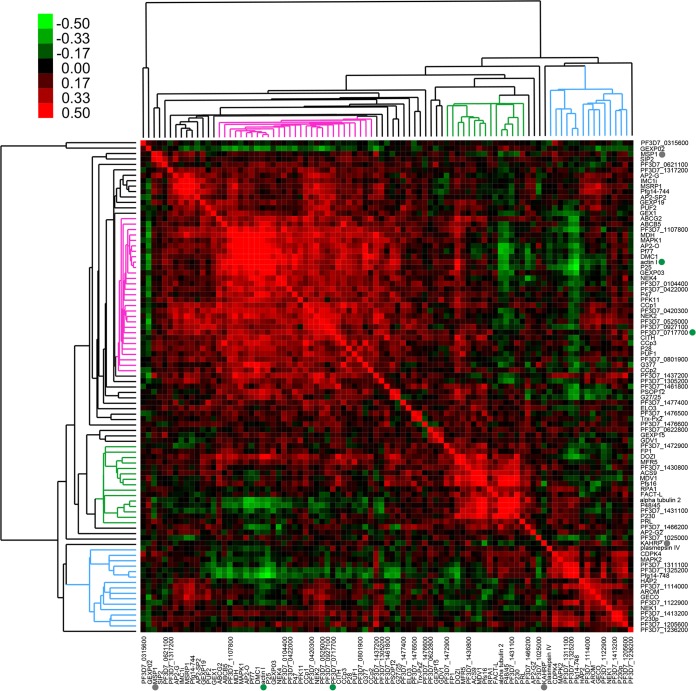
FIG 2 .
Pearson correlation of gene expression identifies distinct groups of male- and female-enriched genes. Eighty-seven gametocyte-specific genes, two housekeeping genes (solid green circles), and two asexual markers (solid gray circles) were used in single-cell qPCR and subsequent analyses. The raw CT values for single-cell expression in 89 gametocytes, 1 asexual cell, and 2 population controls were normalized to the average of the RNA spike-ins before Pearson correlation analysis was performed. The pink cluster denotes female-associated genes, while the blue cluster denotes male-associated genes. The green cluster includes genes that are constitutively expressed in all samples.

