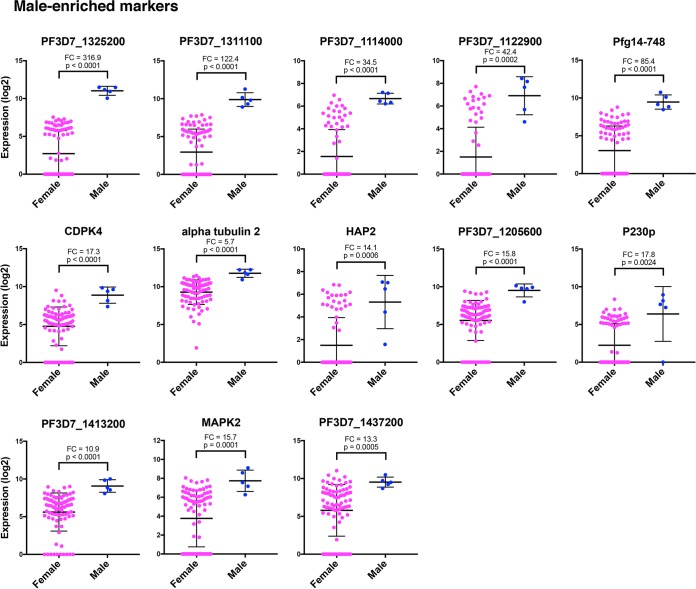
FIG 4 .
Individual genes exhibit distinct male-enriched expression patterns. Dot plots represent the most robust markers for male and female sexual differentiation ordered by PCA gene scores, with the topmost left gene being the most informative. The Mann-Whitney test was used to determine the significance of gene expression differences in males versus females. Values for the female and male gametocytes are shown as means ± standard deviations (error bars). The mean fold change (FC) in gene expression between males and females and the P value are shown for each gene.

