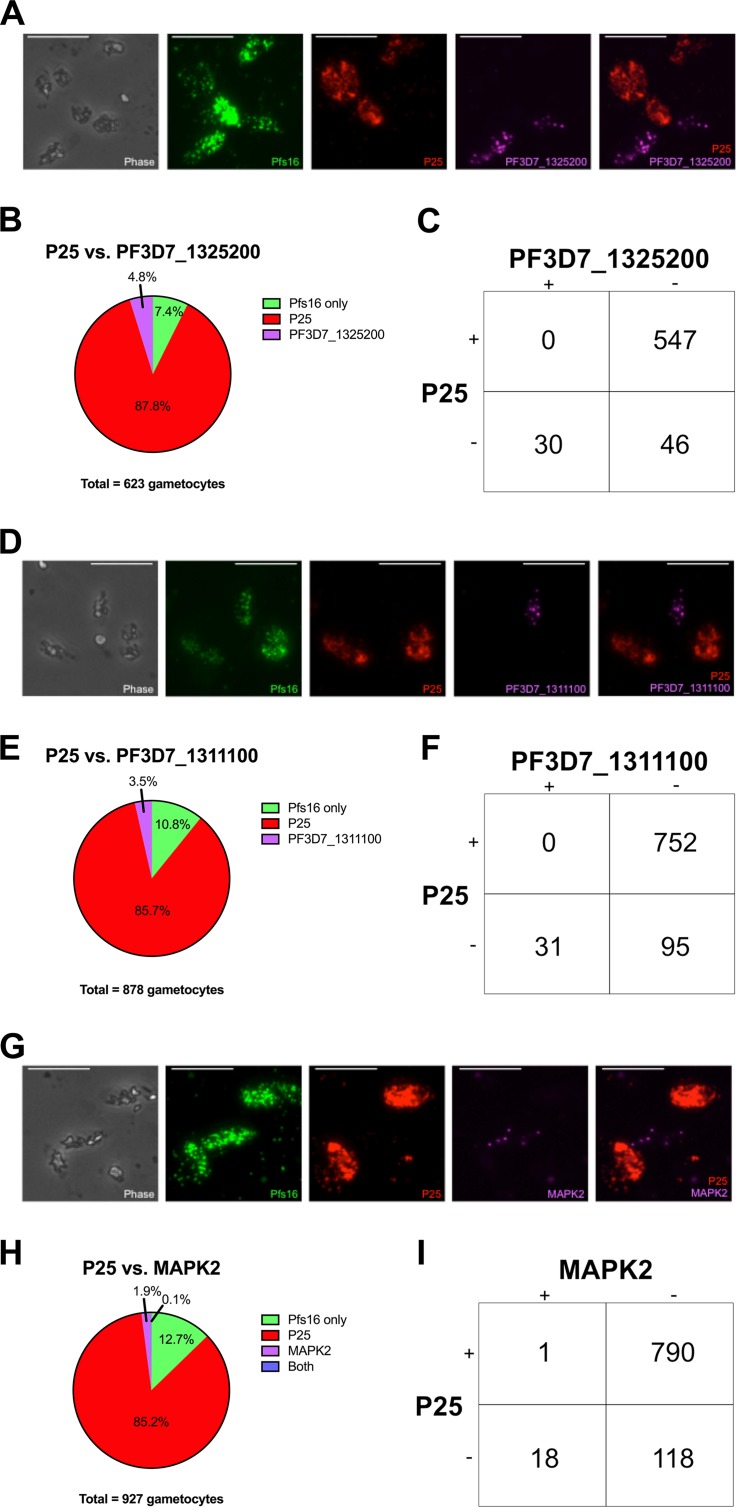
FIG 6 .
RNA-FISH validation of male and female markers. (A) Representative images of gametocytes expressing Pfs16 (gametocyte [green]), P25 (female [red]), and PF3D7_1325200 (male [purple]). Bars, 5 µm. (B) Pie chart showing the distribution of P25 and PF3D7_1325200 expression in Pfs16+ cells. (C) Diagram representing mutually exclusive expression of P25 and PF3D7_1325200. (D) Representative images of gametocytes expressing Pfs16 (gametocyte [green]), P25 (female [red]), and PF3D7_1311100 (male [purple]). (E) Pie chart showing the distribution of P25 and PF3D7_1311100 expression in Pfs16+ cells. (F) Diagram representing mutually exclusive expression of P25 and PF3D7_1311100. (G) Representative images of gametocytes expressing Pfs16 (gametocyte [green]), P25 (female [red]), and MAPK2 (male [purple]). (H) Pie chart showing the distribution of P25 and MAPK2 expression in Pfs16+ cells. (I) Diagram representing mutually exclusive expression of P25 and MAPK2.

