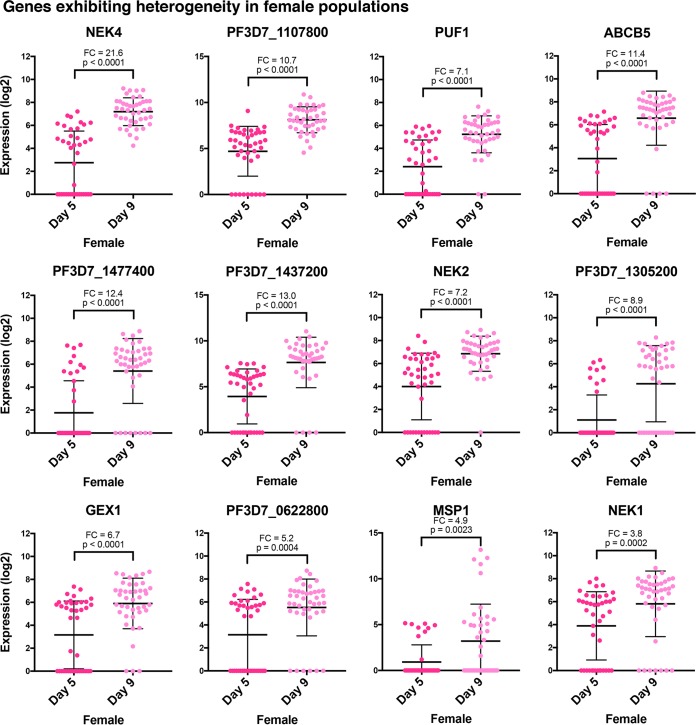
FIG 7 .
Individual genes exhibit distinct stage-specific expression among female gametocytes. Dot plots, which are ordered by PCA gene scores, show that a number of genes are more highly expressed in gametocytes collected on day 9 than in gametocytes collected on day 5. Many genes also have a bimodal distribution of gene expression on day 5. The Mann-Whitney test was used to determine the significance of gene expression differences in samples collected on day 5 versus day 9. The error bars represent the mean with the standard deviation. The mean fold change (FC) in gene expression in female gametocytes collected on day 9 and day 5 is shown for each gene.

