Figure 7.
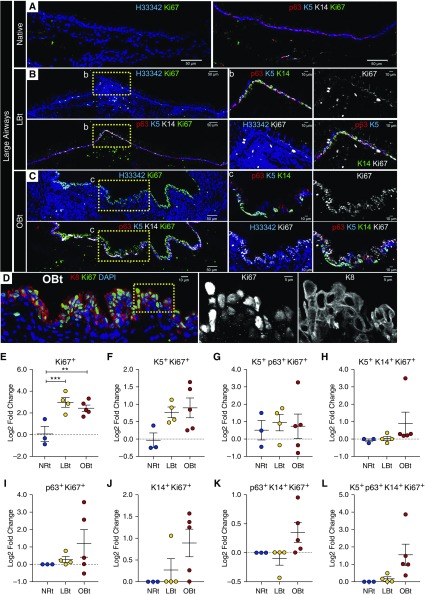
Proliferation in large airways of ferret pulmonary allografts. (A–C) Shown are representative immunofluorescent images of ferret airways stained for Ki67 in addition to basal cell markers, K5, p63, K14, and nuclear Hoechst 33342 (H33342) contrasting large airways from a native lobe (A), an allograft with lymphocytic bronchiolitis (LBt) (B), and an allograft with obliterative bronchiolitis (OBt) (C). Lower-magnification panels indicate Ki67 (green) staining with H33342 (blue) alone or Ki67 (green) costaining with p63 (red), K5 (blue), and K14 (white). Higher-magnification images of the boxed regions indicated in B and C are displayed to the right and include triple-channel p63 (red), K5 (blue), and K14 (green) images, single-channel Ki67 (white) images, double-channel H33342 (blue) and Ki67 (white) images, and four-channel p63 (red), K5 (blue), K14 (green), and Ki67 (white) images. Scale bars indicate 50 μm in lower-magnification images and 10 μm in higher-magnification images. (D) Representative OBt airway with costaining of Ki67, K8, and nuclear Hoechst 33342 (H33342). To the right of D are higher-magnification, single-channel images of Ki67 and K8 staining from the indicated boxed region, and the scale bars indicate 10 μm in the lower-magnification image and 5 μm in the higher-magnification images. (E–L) Quantification of Ki67+ cell phenotypes lacking basal cell markers (E), or coexpressing K5 (F), K5 and p63 (G), K5 and K14 (H), p63 alone (I), K14 alone (J), p63 and K14 (K), or all three markers (L). Statistical analysis was performed by two-way analysis of variance and Tukey multiple comparison post hoc test: **P < 0.01; ***P < 0.001. Data points indicate the comparative log2 fold change of individual animal allografts to native lobes, with black lines indicating mean = SEM. NRt = transplant lobes with no allograft airway rejection.

