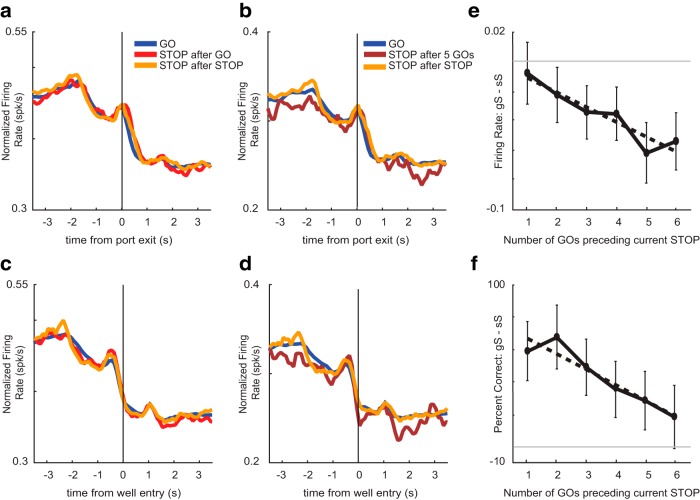
Figure 7.
Effects of trial order on non-DA firing. Average non-DA activity (n = 475) plotted for GO trials, STOP trials preceded by a GO trial (gS), and STOP trials preceded by a STOP trial (sS). A, C, Average population histogram for GO trials (blue), gS (red), and sS (orange) trial types aligned to port exit (A) and well entry (C). B, D, Average population histogram for GO trials (blue), STOP trials after five GO trials (maroon), and sS trials (orange) aligned to port exit (B) and well entry (D). E, To quantify effects, we computed indices on firing rates to compare sS to STOP trials with one to six previous GO trials gS to GO trials (gS – GO/gS + GO) during the post-response epoch. F, Percentage correct behavior on STOP trials preceded by one through six GO trials.

