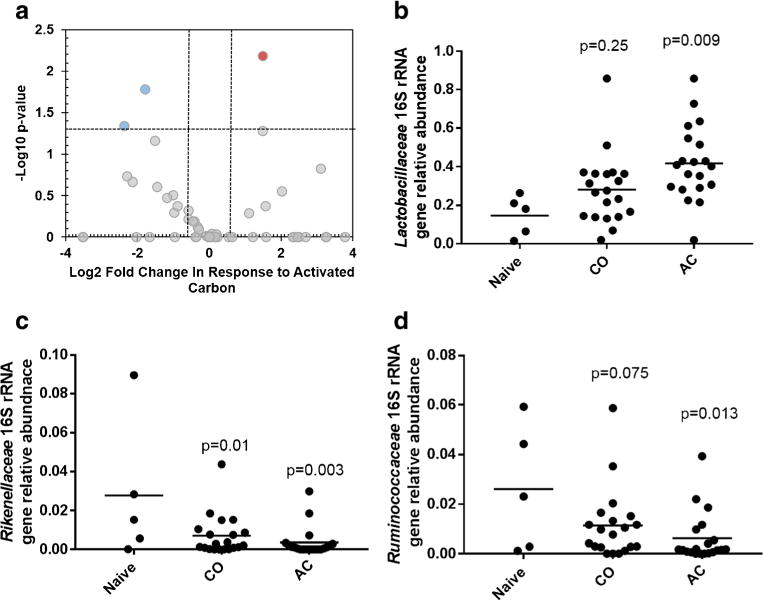
Fig. 3.

16S rRNA gene sequence analysis using DNA extracted from ileum comparing naïve mice with groups dosed with corn oil (CO) or dosed with activated carbon (AC). a Volcano plot showing −Log10 p value and Log2 fold change for bacterial sequences classified at the family level between naïve mice and mice dosed with AC and b–d the taxonomic families significantly influenced with AC
