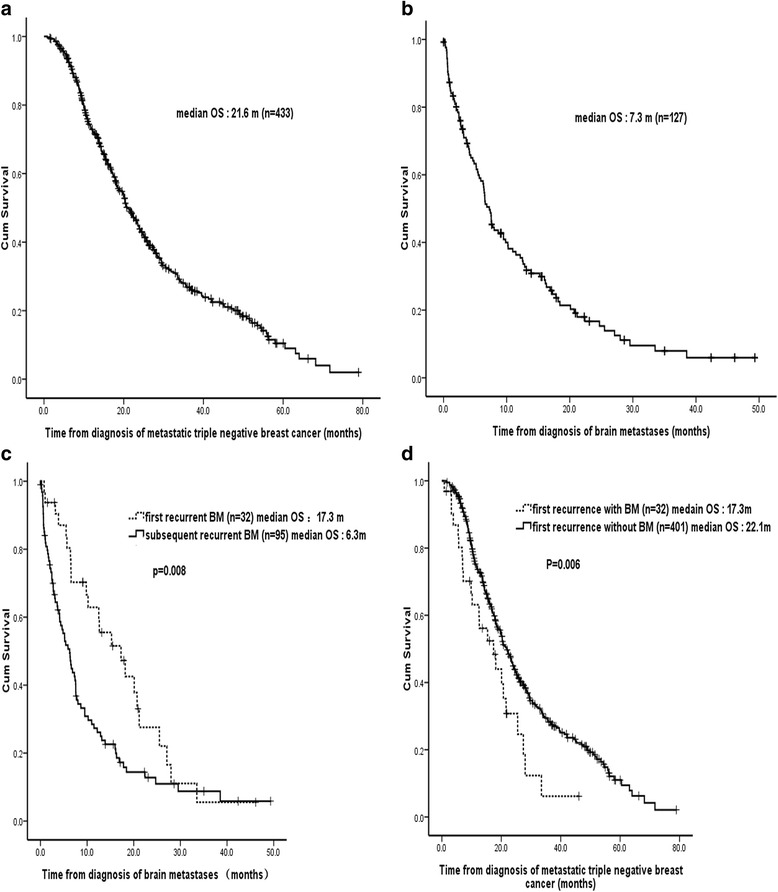
Fig. 1.

Overall survival of patients with mTNBC. a Kaplan–Meier survival curve of 433 patients with mTNBC. b Kaplan–Meier survival curve of 127 patients with BM from TNBC. c Kaplan-Meier plots illustrating survival of patients had BM initially involved and those subsequently involved. The longer median survival from time of brain metastases diagnosis that is seen in the first recurrent BM compared with the subsequent recurrent BM (17.3 vs 6.3 months, p = 0.008). d Kaplan-Meier plots illustrating survival of patients with first BM recurrence presence and those absence. Patients with BM initial presence were associated with shorter OS (17.3 vs 22.1 months, p = 0.006)
