
Fig. 2.
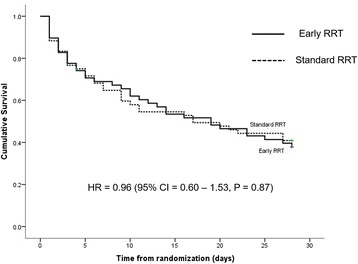
Survival curves of patients receiving early and standard renal replacement therapy (RRT) (straight line, early RRT group; dashed line, standard RRT group). The figure shows the Kaplan-Meier curve of the probability of survival from randomization to day 28. CI, confidence interval; HR, hazard ratio