
Fig. 6.
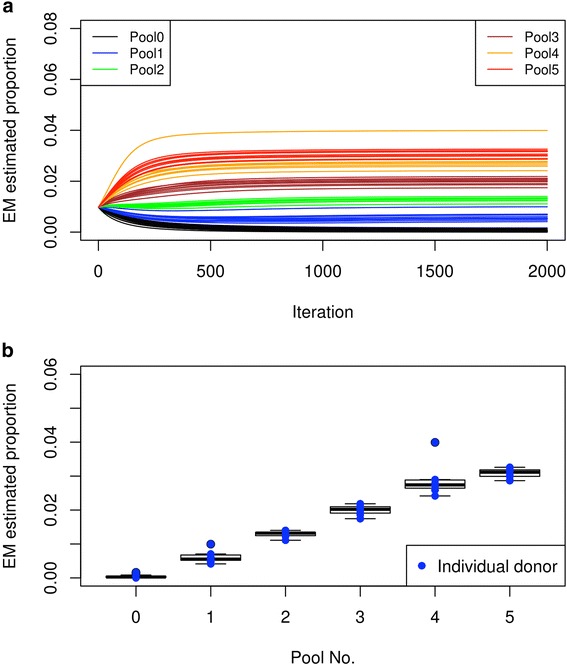
Estimating individual donor proportion after cell sorting each donor into a mixed pool. Similar to Fig. 5, but a cell sorter was used to accurately sort each individual donor cells into the mixed pool (see “Methods”). Note that the donors for each pool are different from those depicted in Fig. 5 (Additional file 2: Table S6). a The estimated proportion (y-axis) at each iteration (x-axis) when running the algorithm. The different colors represent donors from different pools. b Box plot of the final estimate of the donor proportion for each pool. The blue dots indicate the estimate for each individual donor