
Figure 1.
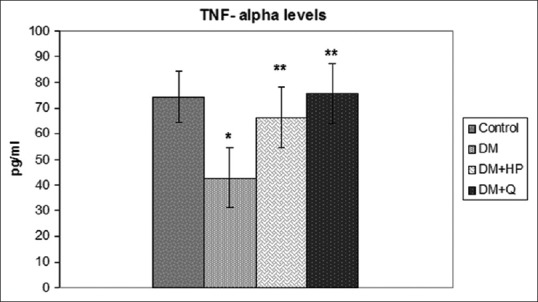
Serum tumor necrosis factor alpha levels in experimental groups. *Significantly different when compared with control group, (P < 0.05), **Significantly different when compared with diabetes mellitus group, (P < 0.05)
Official websites use .gov
A
.gov website belongs to an official
government organization in the United States.
Secure .gov websites use HTTPS
A lock (
) or https:// means you've safely
connected to the .gov website. Share sensitive
information only on official, secure websites.
Serum tumor necrosis factor alpha levels in experimental groups. *Significantly different when compared with control group, (P < 0.05), **Significantly different when compared with diabetes mellitus group, (P < 0.05)