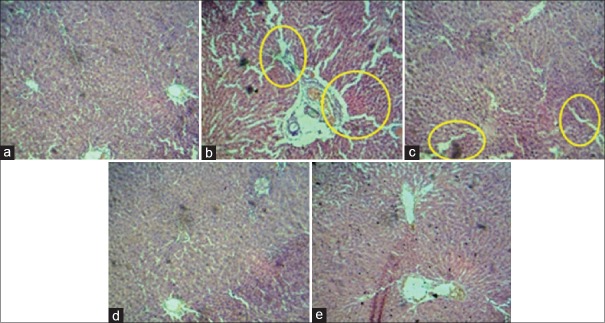
Figure 3.
Histopathology of liver from control and experimental groups of animals, circle mark indicated that damage of liver cell. (a) Liver section of normal control Group I, (b) liver section of antitubercular drug-treated Group II, (c) liver section of antitubercular drug and ethanolic extract of Trapa natans (200 mg/kg)-treated Group III, (d) liver section of antitubercular drug and ethanolic extract of Trapa natans (400 mg/kg)treated Group IV, and (e) liver section of rats treated antitubercular drug and 100 mg/kg of silymarin Group V

