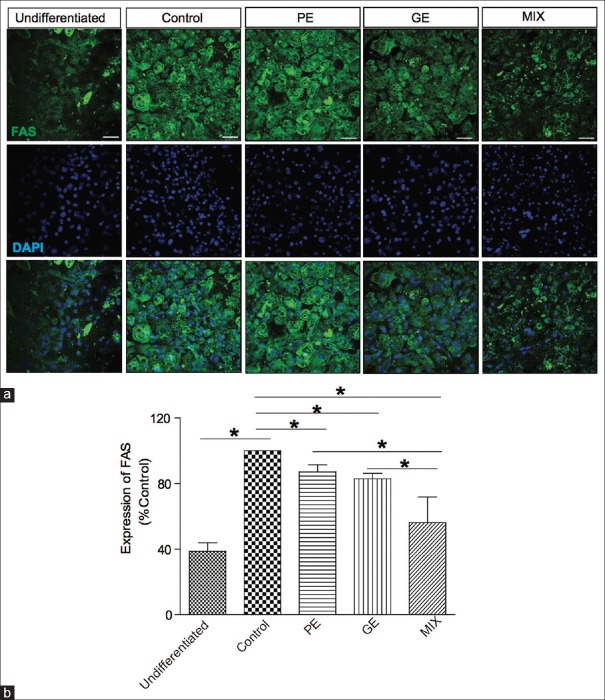
Figure 5.
Effect of PE, GE, and MIX on the expression of FAS in 3T3-L1 adipocytes. (a) Representative image of immunofluorescence labeled FAS. (b) Graphical representation of fluorescence intensity of FAS. Values are mean ± standard deviation (n = 3) *P < 0.05. FAS: Fatty acid synthase; PE: Pear pomace extract; GE: Garcinia cambogia extract

