FIGURE 2.
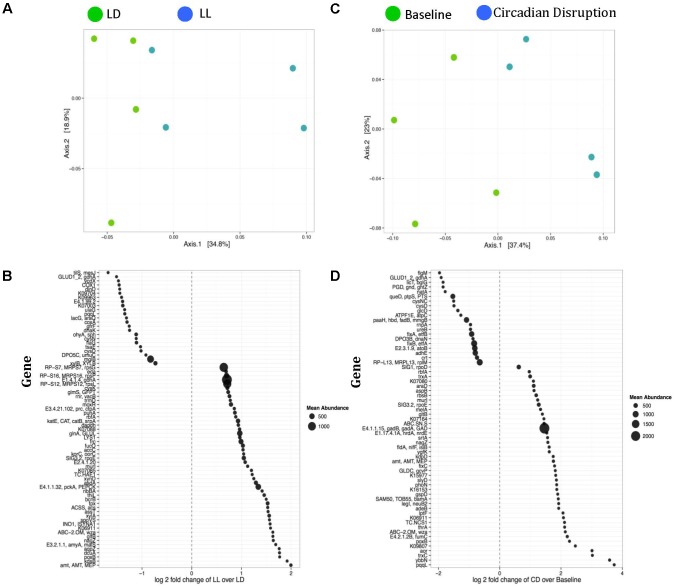
Weighted ordination plots of functional genes show a clear distinction between the LD and LL groups after 4 weeks of circadian rhythms disruption (A) and between baseline and circadian rhythms disruption (C). These plots illustrate the dimensional reduction of the Bray–Curtis distance between samples, using the PCoA ordination method. In PCoA, the axes are eigenvectors that separate the samples in high-dimensional space. Two vectors were selected that explain the most variation in the samples. A PERMANOVA using distance matrices was performed for each variable of interest to determine if they significantly contributed to the beta-diversity of the samples. There were 72 differentially expressed genes between the LD and LL groups after 4 weeks of circadian rhythms disruption (B) and 63 differentially expressed genes between the baseline and circadian rhythms disruption (D). LD, 12-h light/dark cycles; LL, 12-h light/light cycles.

