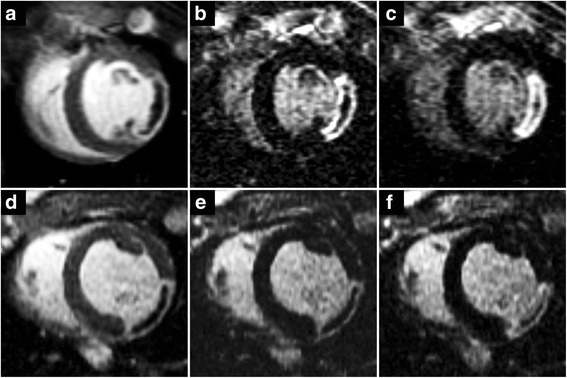
Fig. 5.

Contrast uptake characteristics of the no-flow region (NF) in reperfused and non-reperfused myocardial infarct (MI). Short-axis oriented post-contrast inversion recovery images acquired in a reperfused (top row) and a non-reperfused (bottom row) animal at 2 min (a, d), 15 min (b, e), and 45 min (c, f) after the administration of the contrast agent (CA). Early gadolinium enhancement images (a, d) are best to visualise the NF, while late gadolinium enhancement images at 15 min post contrast (b, e) are regularly used clinically to highlight MI. The area of the NF is the largest immediately after CA administration and gradually shrinks over time. By the end of the imaging session 45 min post contrast (c, f) the area previously shown as the NF now seems to be partially highlighted. CA distribution within the NF, however, is not uniform and the NF still contains unenhanced areas
