. 2018 Jan 22;9(9):2443–2451. doi: 10.1039/c7sc04671e

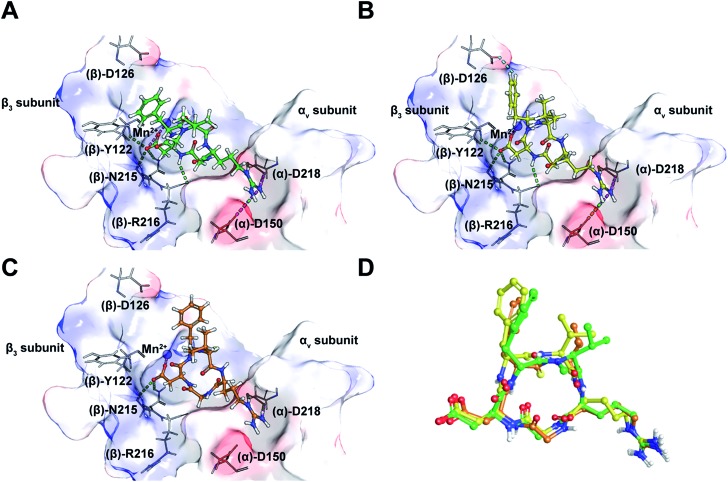
Fig. 3. (A) The interaction of cilengitide (shown as a green ball and stick model) bound to the αvβ3 integrin in the PDB entry 1L5G. (B) The interaction of docked 9b (shown as a yellow ball and stick model) with the αvβ3 integrin. (C) The interaction of docked 7 (shown as an orange ball and stick model) with the αvβ3 integrin. (D) An overlay of the docked poses of 9b and 7 onto that of Cilen co-crystallized with the αvβ3 integrin in ; 1L5G. The green, magenta and cyan dashed lines represent hydrogen bonds, salt bridges and aromatic hydrogen bonds, respectively. The binding site of the protein is shown as a surface representation and the carbon atoms of the protein residues are shown in grey. Oxygen, nitrogen, hydrogen and sulphur atoms are shown in red, blue, white and yellow, respectively. Please see the ESI for a detailed description of the interactions between the various ligands and the αvβ3 integrin.

Fig. 3