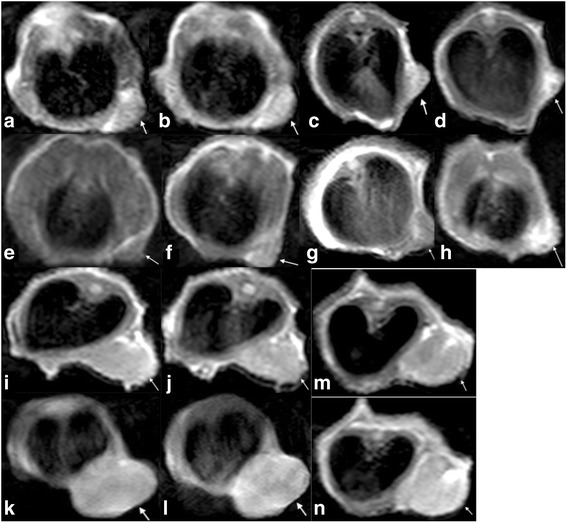
Fig. 5.

T1-weighted imaging of pre- and post-Mn administration in 5- and 10-mm group xenografts. Arrows in the images from a to n point to subcutaneous tumour. Images a, c, e, g, i, k, m and b, d, f, h, j, l and n represent pre- and post-Mn administration, respectively. Images a, b and k, l are low-metastatic-potential DLD-1 tumours. Images c and d are of a high-metastatic-potential SW620 tumour. Images e, f and i, j are low-metastatic-potential HCT15 tumours. Images g, h and m, n are high-metastatic-potential LoVo tumours. SW620 and LoVo tumours display greater enhancement than DLD-1 and HCT15 tumours
