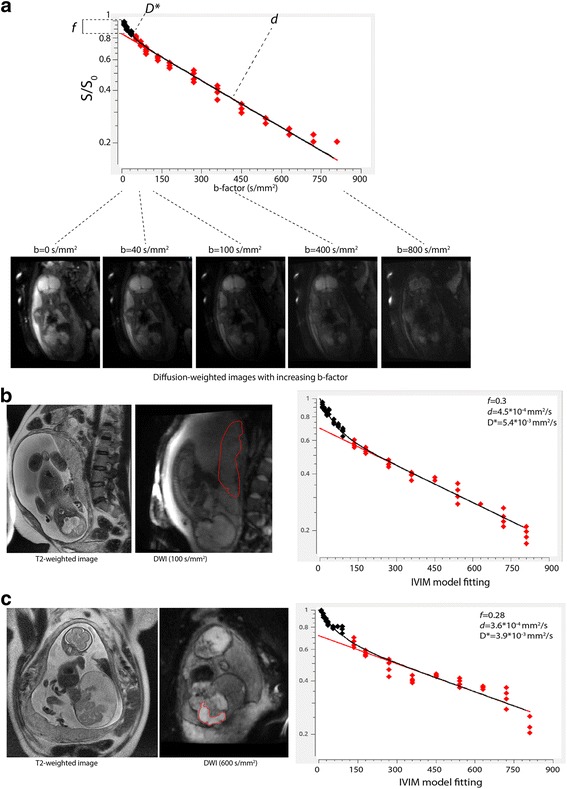
Fig. 3.

IVIM imaging in utero. a Bi-exponential model fitting on the DWI measurements that have been acquired with increasing b-factor. b IVIM imaging of the placenta. Left: coronal T2-weighted image; middle: DW image (placenta delineated); right: IVIM signal and estimates of the diffusion coefficient d, pseudo-diffusion coefficient D* and the microvascular perfusion fraction f, based on VOI-averaged values. c IVIM image of a sacrococcygeal teratoma
