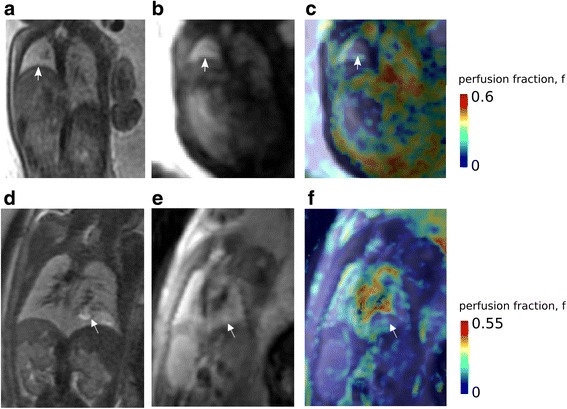
Fig. 5.

a–c Congenital diaphragmatic hernia: hypoplastic left lung (arrow); normal right lung. a T2-weighted coronal image. b DWI, b-factor = 0 image. c IVIM perfusion fraction map showing decreased microvascular perfusion fraction in the hypoplastic left lung. d–f Congenital cystic adenomatoid formation of the right lung. d Coronal T2-weighted image showing a hyperintense abnormality at the inferior lobe of the right lung. e DWI, b-factor = 0 image. f IVIM perfusion fraction map showing a demarcated zone of decreased microvascular perfusion fraction in the affected region of the inferior lobe (arrow)
