Fig. 4.

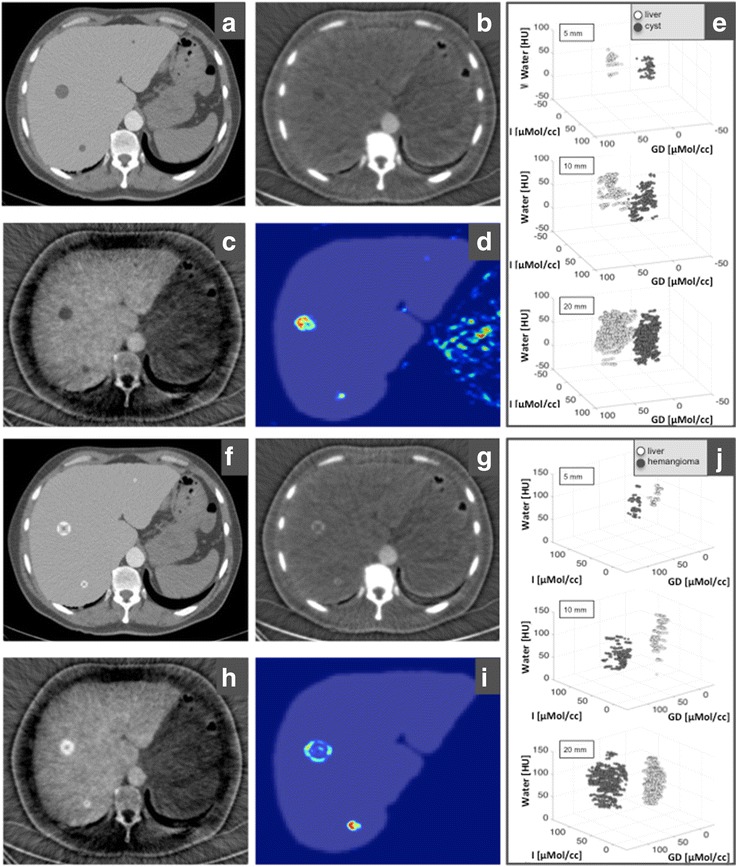
SPCCT imaging of benign liver lesions, exemplified by cysts (a–e) and haemangiomas (f–j). a, f Conventional CT image. b Iodine-enhanced image, showing cysts without any contrast uptake in the arterial phase. c Gadolinium-enhanced image showing cysts in portal venous phase. g, h Iodine- and gadolinium-enhanced image of haemangiomas, with a typical closing-iris pattern. d Likelihood map showing the 20-mm, 10-mm, and 5-mm diameter cysts. i For haemangiomas, the smallest lesion was missed in the calculated likelihood map. e, j Scatter plots illustrate the results of integrative analysis of SPCCT images with regard to the content of iodine and gadolinium as well as the non-contrast fraction (= water) for all lesions and all sizes without significant overlap of liver parenchyma (light grey) and lesion (dark grey). For this, two ROIs in the three material images were evaluated; one ROI was placed in the lesion (dark grey markers) and the other in healthy liver tissue (light grey markers). Image windowing: a and f, level/window 50/300 HU; b and g, level/window 25/100 μmol/cc of iodined CA; c and h, level/window 25/100 μmol/cc of gadolinium-based CA
