Fig. 5.

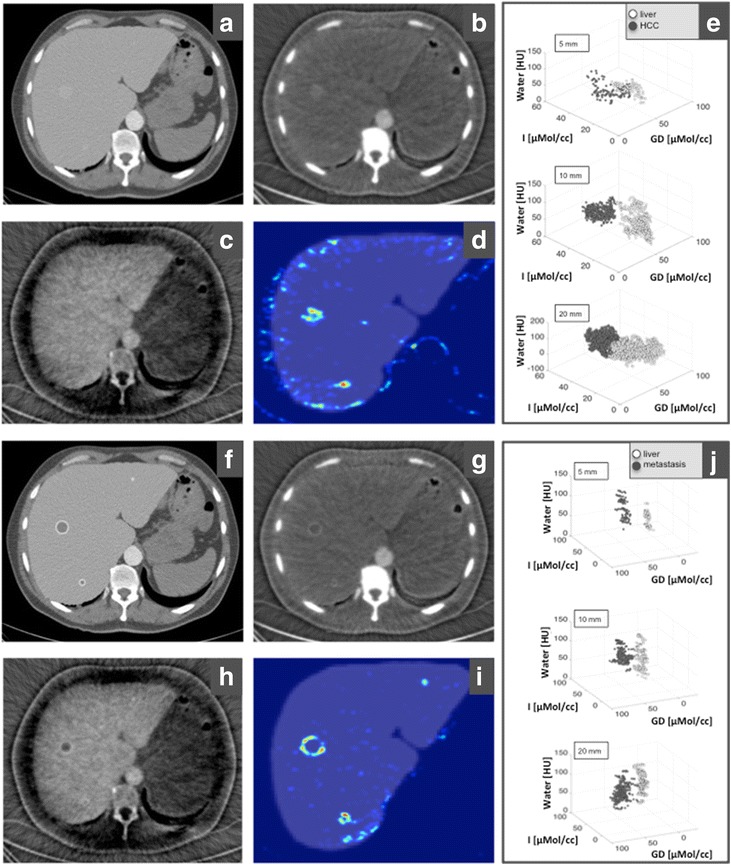
SPCCT imaging of malignant liver lesions, exemplified by HCC (a–e) and metastasis (f–j). a, f Conventional CT image. b Iodine-based image, showing HCC with a typical hyper-enhancement in arterial phase. c Gadolinium-based image of HCC in portal venous phase, which shows only subtle early washout with hypodense presentation in the largest lesion. g, h Iodine- and gadolinium-based image of metastases, with a typical ring-like enhancement in the arterial phase (g), increased in the portal venous phase (h). d Likelihood map for HCC, which shows HCC in the right lobe but misses the small lesion in the left lobe, due to artifacts along the liver contour. i For metastases, the likelihood map clearly illustrated all the three lesions. e, j The scatter plots show an overlap for the fractionised analysis for iodine, gadolinium and water for HCC (e, dark grey), whereas all metastases (j, dark grey) are clearly separated from liver parenchyma (e, j, light grey). For this, two ROIs in the three material images were evaluated, one placed in the lesion (dark grey markers) and the other one in healthy liver tissue (light grey markers). Image windowing: a and f, level/window 50/300 HU; b and g, level/window 25/100 μmol/cc of iodined CA; c and h, level/window 25/100 μmol/cc of gadolinium-based CA
