Fig. 11.

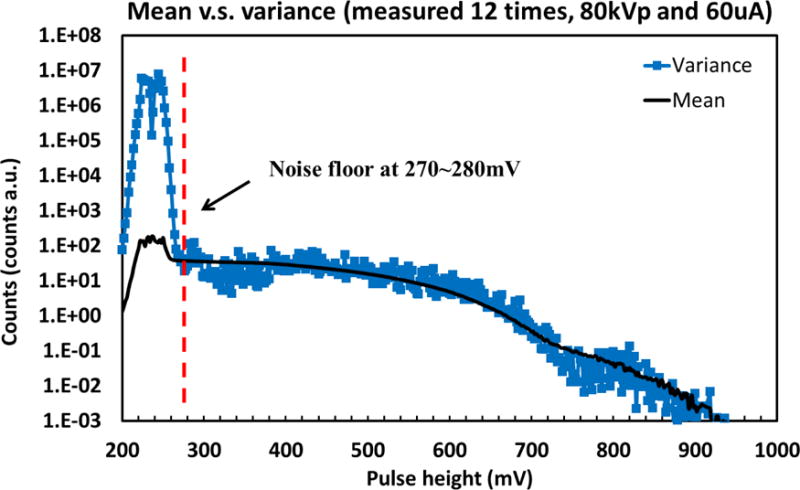
Comparison between mean and variance: S-curve measured under 80kVp and 60uA for 12 times, showing that the mean and the variance are comparable above 280mV (noise floor) while significant difference exists below the noise floor.

Comparison between mean and variance: S-curve measured under 80kVp and 60uA for 12 times, showing that the mean and the variance are comparable above 280mV (noise floor) while significant difference exists below the noise floor.