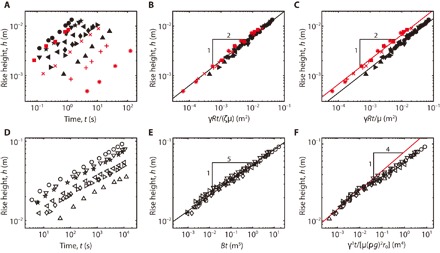
Fig. 4. Wicking dynamics in different stages.

(A) Experimentally measured rise height versus time in the early stages. (B) The early-stage data are collapsed onto a single line when plotted according to our scaling law h ~ [γRt/(ζμ)]1/2. The law holds for both the aqueous and nonaqueous liquids. (C) Two collapsed lines for aqueous (black line) and nonaqueous liquids (red line). (D) Experimentally measured rise height of aqueous liquids versus time in the late stages. (E) The late-stage data are collapsed onto a single line when plotted against our scaling law h ~ (Bt)1/5. (F) The experimental results appear to collapse onto a single line but disobey the t1/4 rule (Eq. 1). The symbols for different liquids are listed in table S1.
