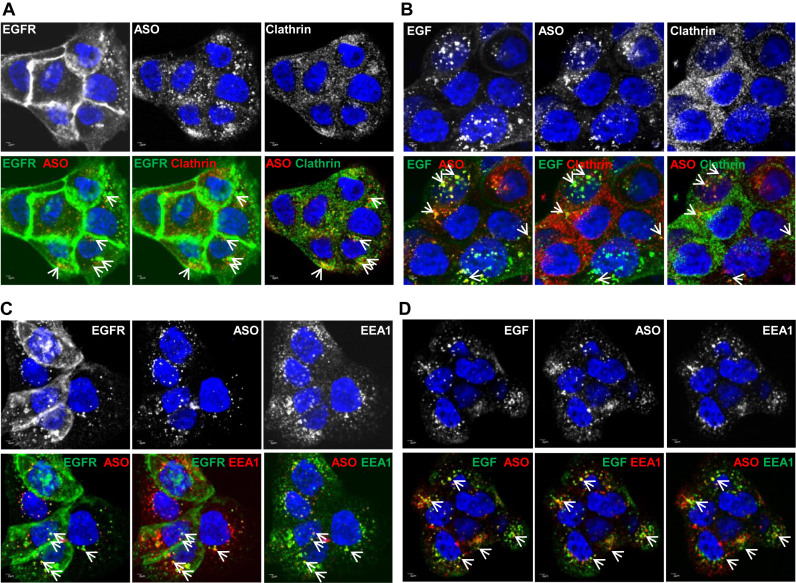
Figure 2.
PS-ASOs traffic together with EGF and EGFR through the endocytic pathway. (A) Representative images of immunofluorescent staining for clathrin and EGFR in A431 cells incubated with non-labeled EGF and Cy3-labeled PS-ASOs for 30 min. The nuclei were stained with Hoechst 33342 (blue). The arrow indicates co-localization between EGFR (green) and PS-ASOs (red); between EGFR (green) and clathrin (red); between PS-ASOs (red) and clathrin (green). Scale bars, 2 μm. (B) Representative images of immunofluorescent staining for clathrin in A431 cells incubated with FITC-EGF and Cy3-labeled PS-ASOs for 30 min. The nuclei were stained with Hoechst 33342 (blue). The arrow indicates co-localization between EGF (green) and PS-ASOs (red); between EGF (green) and clathrin (red); between PS-ASOs (red) and clathrin (green). Scale bars, 2 μm. (C) Representative images of immunofluorescent staining for EEA1 and EGFR in A431 cells incubated with non-labeled EGF and Cy3-labeled PS-ASOs for 30 min. The nuclei were stained with Hoechst 33342 (blue). The arrow indicates co-localization between EGFR (green) and PS-ASOs (red); between EGFR (green) and EEA1 (red); and between PS-ASOs (red) and EEA1 (green). Scale bars, 2 μm. (D) Representative images of immunofluorescent staining for EEA1 in A431 cells incubated with FITC-EGF and Cy3-labeled PS-ASOs for 30 min. The nuclei were stained with Hoechst 33342 (blue). The arrow indicates co-localization between EGF (green) and PS-ASOs (red); between EGF (green) and EEA1 (red); between PS-ASOs (red) and EEA1 (green); Scale bars, 2 μm.

