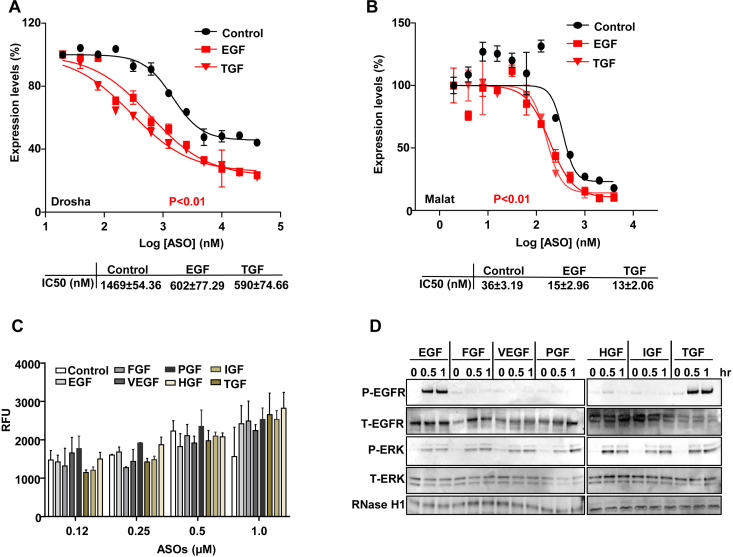
Figure 5.
EGF increases the activity but not uptake of PS-ASOs in A431 cells. (A and B) Reduction of Drosha (A) and Malat1 (B) RNA was determined by qRT-PCR analysis of A431 cells treated with EGF or TGF for 4 h before they were incubated with PS-ASOs. Data are relative to untreated cells. The error bars represent standard deviations from 3 independent experiments. Activity curves were fitted from data plotted in panels and IC50 was calculated based on a non-linear regression model. P (in red) <0.01, EGF or TGF treatment versus control; P values were computed by one-way ANOVA as the concentrations of PS-ASOs were set as random effect. (C) Intracellular fluorescence of Cy3-PS-ASOs was quantified by flow cytometry to determine PS-ASO uptake (RFU) in A431 cells treated with different growth factors for 4 h before they were incubated with Cy3-PS-ASOs for 2 h. The error bars represent standard deviations from 3 independent experiments. (D) Western analyses of proteins from A431 cells treated with different growth factors for indicated times. The blot was probed sequentially with different antibodies: phosphorylated EGFR (P-EGFR), total EGFR (T-EGFR), phosphorylated ERK (P-ERK), total ERK (T-ERK) and RNase H1.

