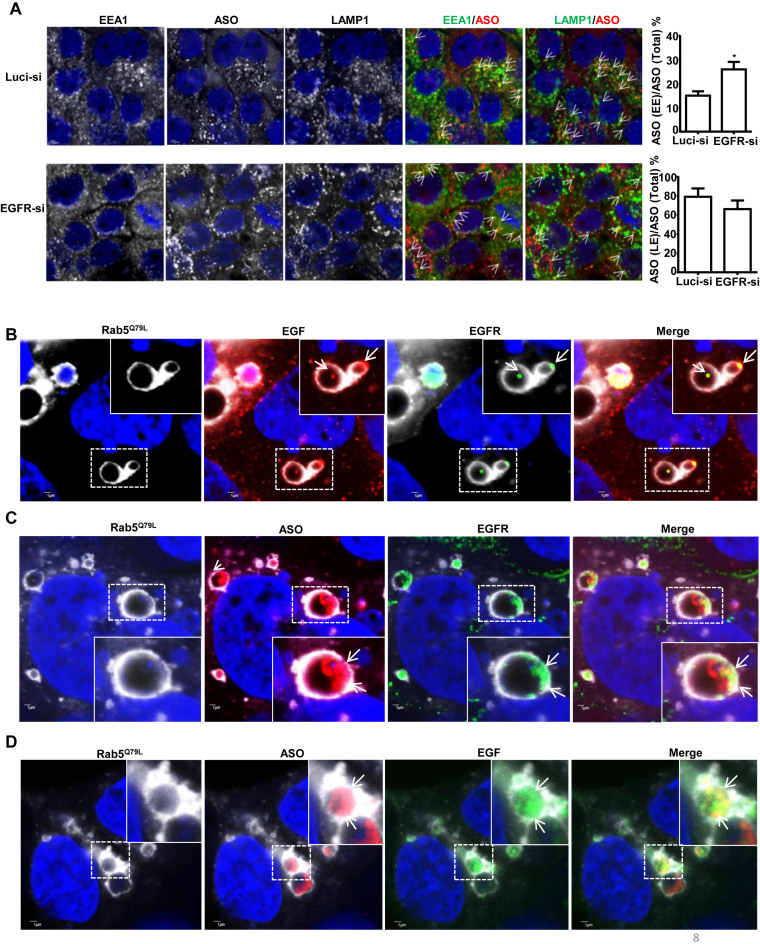
Figure 8.
Reduction of EGFR delays PS-ASO trafficking from early to late endosomes. (A) Representative images of immunofluorescent staining for EEA1 (green), and LAMP1 (green) in control (Luci-si) or EGFR reduced (EGFR-si) A431 cells incubated with Cy3-labeled PS-ASOs (red) for 2 h. Representative co-localization was indicated by arrows, between EEA1 or LAMP1 and PS-ASO; Scale bars, 2 μm. The PS-ASO-positive EEs or LEs were counted in 20 cells, and the percentage of the PS-ASO-positive EEs or LEs was calculated relative to the total numbers of the PS-ASO-positive foci; *P< 0.05, computed by Student's t-test. (B) Representative images of immunofluorescent staining for EGFR in RAB5(Q79L)-GFP overexpressing A431 cells treated with Alexa Fluor 647-EGF for 4 h. The nuclei were stained with Hoechst 33342 (blue). Enlarged images show co-localization, indicated by arrows, between EGFR (green) and EGF (red); Scale bars, 1 μm. (C) Representative images of immunofluorescent staining for EGFR in RAB5(Q79L)-GFP overexpressing A431 cells treated with Cy3-PS-ASOs and non-labeled EGF. The nuclei were stained with Hoechst 33342 (blue). Enlarged images show co-localization, indicated by arrows, between EGFR (green) and PS-ASOs (red); Scale bars, 1 μm. (D) Representative images of RAB5(Q79L)-GFP overexpressing A431 cells treated with Alexa Fluor 647-EGF and Cy3-PS-ASOs for 4 h. Enlarged images show co-localization, indicated by arrows, between PS-ASOs (red) and EGF (green); The nuclei were stained with Hoechst 33342 (blue). Scale bars, 1 μm.

