Figure 3.
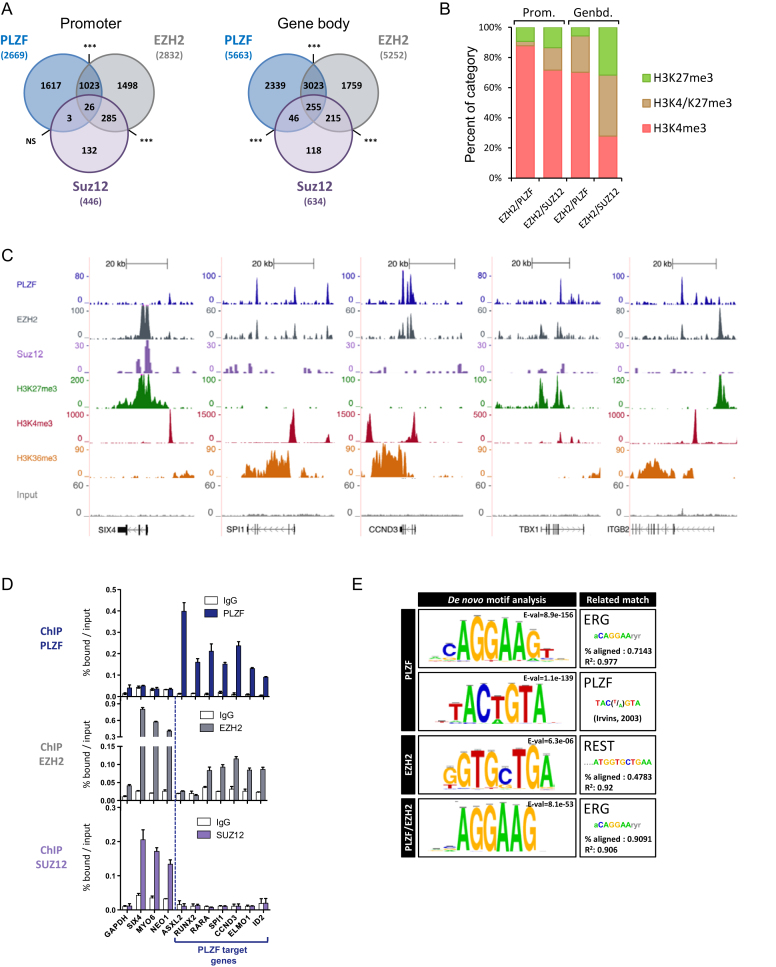
PLZF and EZH2 share common target genes. (A) Venn diagrams showing the association between PLZF, EZH2 and SUZ12 bound regions at promoter (−2.5kb/+0.1 kb from TSS) and gene body (+0.1 kb from TSS to TES) regions. Association between two peaks was considered if they were localized on the same genomic feature of the same gene. NS not significant, ***P < 0.001 (hypergeometric test). (B) Percentages of H3K4me3 unique, H3K27me3 unique or H3K4me3/H3K27me3 marks in EZH2/PLZF (without SUZ12) or EZH2/SUZ12 (without PLZF) target genes, at promoter (Prom.) or gene body (Genbd.). (C) UCSC genome browser views of EZH2, PLZF and SUZ12 ChIP-seq and associated histone marks in KG1 cells. (D) ChIP-qPCR analysis of PLZF, EZH2 and SUZ12 on selected target genes. Percentages of bound DNA over input are shown as a mean ±SD of two independent experiments (n = 3–5). (E) Motif search at PLZF, EZH2 or PLZF/EZH2 summit regions.

