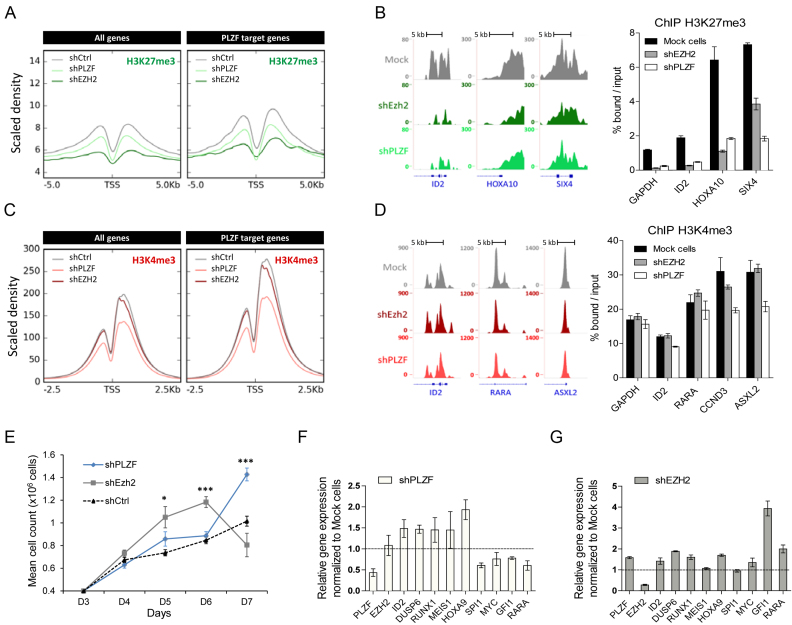
Figure 6.
Effect of PLZF and EZH2 KDs on chromatin structure and gene expression. (A) Density profile of H3K27me3 signal tracks after PLZF or EZH2 KDs in KG1 cells. (B) Representative UCSC Genome browser tracks (left panel) of H3K27me3 after PLZF or EZH2 KDs and its associated spike-in ChIP-qPCR validation (right panel). (C) Density profile of H3K4me3 signal tracks after PLZF or EZH2 KDs in KG1 cells. (D) Representative UCSC Genome browser tracks (left panel) of H3K27me3 after PLZF or EZH2 KDs and its associated spike-in ChIP-qPCR (right panel) validation. (E) Proliferation assay of Trypan blue stained KG1 cells expressing shPLZF, shEZH2 or shCtrl. Data are expressed as mean cell count ±SEM of two individual clones (three replicates each) with *P < 0.05, ***P < 0.001 (t-test compared to shCtrl). (F) Gene expression analysis of PLZF target genes after PLZF KD. (G) Gene expression analysis on PLZF target genes after EZH2 KD. (F and G) Relative level of expression was evaluated using the 2∧ΔΔCT method with PBG-D as the reference gene. Data are presented as a mean ± SD of two independent clones (n = 3–6).

