
Figure 4.
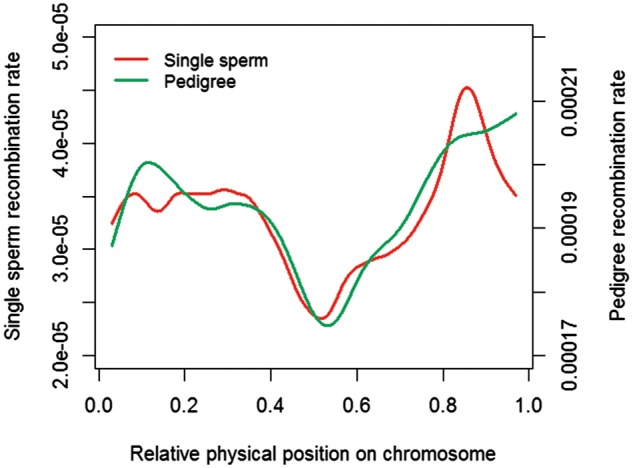
Spline-smoother plot of recombination rate along the chromosome from single sperm data and pedigree data. The relative physical position on a chromosome is used, where zero corresponding to the beginning of a chromosome and one the end. The smooth spline model was fitted across all of the 29 chromosomes. Due to the differences in SNP density, the single sperm and pedigree recombination rates were plotted in different scales.