Figure 3.
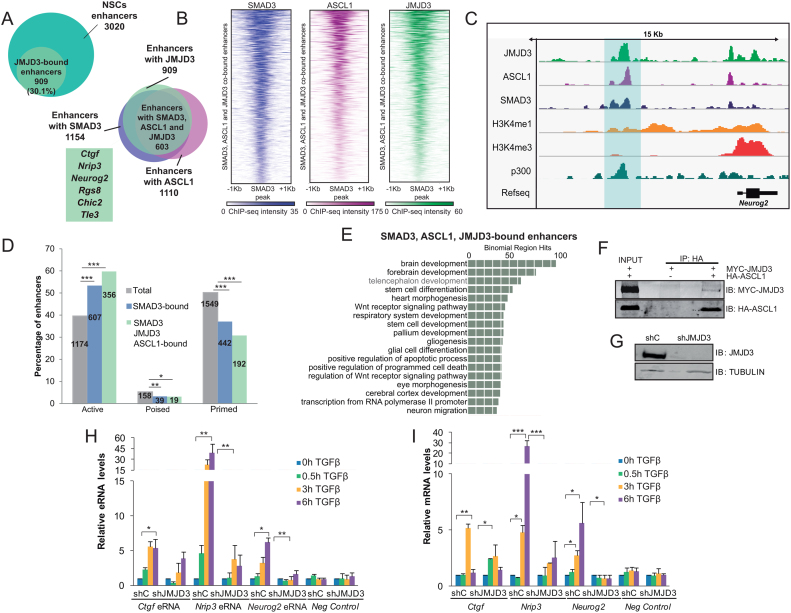
JMJD3 interacts with SMAD3 and ASCL1 at neural enhancers. (A) Venn diagrams showing the number and percentage of JMJD3-bound enhancers after 0.5 h of TGFβ treatment in NSCs (upper panel) and number of enhancers with overlapping ASCL1 (before TGFβ), SMAD3 and JMJD3 peaks (upon 30 min of TGFβ addition) in NSCs. Genes associated to the identified enhancers are indicated. (B) Heatmap showing JMJD3 binding to neural enhancers co-bound by ASCL1, SMAD3 and JMJD3. Scales depict ChIP-seq intensities. (C) IGV capture showing the chromatin landscape around the Neurog2 gene. Enhancer is highlighted in blue. Tracks display ChIP-seq in NSCs treated for 30 min with TGFβ (SMAD3 and JMJD3) or untreated cells (ASCL1, p300, H3K4me1 and H3K4me3). (D) The percentage of active, poised and primed total enhancers, and those bound by SMAD3 or SMAD3/ASCL1/JMJD3 are depicted. Numbers inside the bars indicate absolute number of enhancers. An equal proportions test was performed and asterisks show P-values: *P < 0.05; **P < 0.01; ***P < 0.001. (E) GREAT analysis showing GO Biological Process of the enhancers co-occupied by ASCL1/SMAD3/JMJD3, analysis was performed using as a background the whole Mus musculus genome. (F) 293T cells were transfected with HA-ASCL1 and MYC-JMJD3 as indicated. ASCL was precipitated using the HA tag antibody and the presence of JMJD3 and ASCL1 in the immunopellet was determined by immunoblot with MYC and HA antibodies respectively. Figure is representative of at least three biological independent experiments. (G) NSCs were infected with lentivirus expressing shRNA control (shC) or shRNA specific for JMJD3 (shJMJD3). Forty eight hours later, total protein extracts were prepared and the JMJD3 and TUBULIN levels were determined by immunoblot. (H and I) shC or shJMJD3 NSCs were treated for the indicated times with TGFβ. Levels of the indicated eRNA (J) or mRNA (K) were determined by qPCR. Transcription values were normalized to the housekeeping gene Rps23 and figure shows values relative to time 0 h. Progesterone-responsive Fabp4 eRNA or mRNA were used as negative controls. Results are the mean of three biological independent experiments. Errors bars represent SD. *P < 0.05; **P < 0.01 (Student's t-test).

