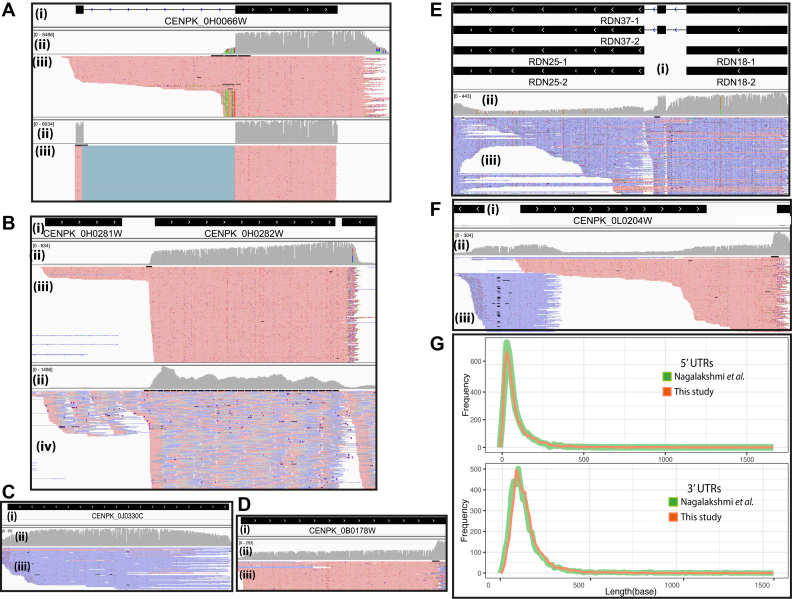
Figure 5.
Transcriptional landscape structure examples illustrated by the snapshots of mapped reads using the IGV software. For panels A–F, i) shows the transcript structure(s), ii) indicates depth coverage, iii) details the mapped long reads of direct RNA sequence data. Red and blue represent the forward and reverse direction of mapped reads, respectively. iv) Shows details of mapped short reads of RNA-Seq data. (A) The different read alignment strategy shows that the non-guided exon alignment, illustrated in the upper panel, visually detects pre-mature transcripts that miss in guided exon alignment, illustrated in the lower panel. (B) The presence of dual transcribed of THI1 and ERG9. (C) The evidence of telomere RNA and (D) The evidence of polyadenylated long non-coding RNA. (E) The evidence of polyadenylated ribosomal RNA. (F) The presence of antisense transcript. (G) The length distribution of 5′UTRs (upper panel) and 3′UTRs (lower panel) of this study compared with Nagalakshmi et al. represented in red and green, respectively.

