. 2018 Feb 6;9(9):2419–2431. doi: 10.1039/c8sc00043c

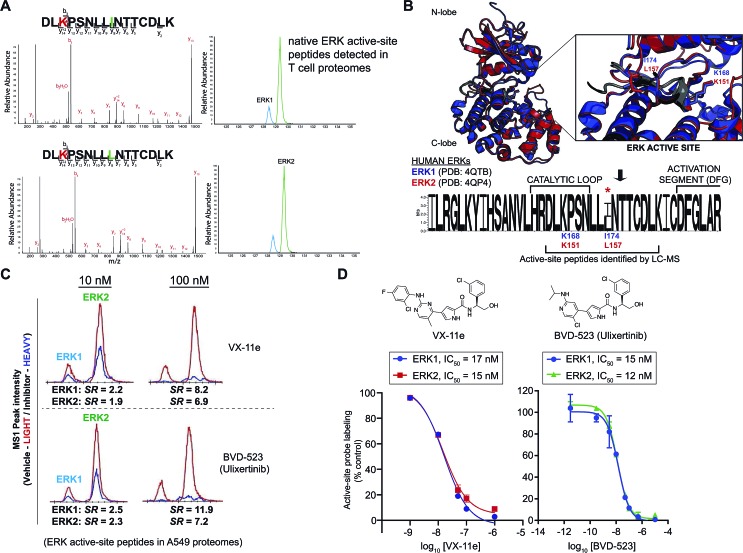
Fig. 4. Enzyme and inhibitor profiling of native ERK isoforms by chemoproteomics. (A) Chemoproteomic analysis of primary human CD4+ T cells. Native ERK1 and ERK2 activity is detected by chromatographically-resolved, active-site peptides with identical MS2 spectra that recapitulates LC-MS findings from brain proteomes in Fig. 3. We obtain similar LC-MS data across diverse cell types as shown in Fig. S1, highlighting use of this approach as a general activity assay of native ERKs. (B) Structural alignment of human ERK1 (PDB ID: ; 4QTB, blue) and ERK2 (; 4QP4, red) as described in the Experimental section. ERK1 and ERK2 exhibit high structural homology and near identical substrate binding sites (inset), which contains the catalytic lysine (ERK1 – K168; ERK2 – K151) that is probe-modified. Sequence logo analysis of LC-MS active site-peptide sequences across 6 mammalian species (human, cow, rodent, monkey, and pig) illustrates complete sequence homology with the exception of the single isoleucine/leucine isomer (ERK1 – I174; ERK2 – L157) that distinguishes ERK1 and ERK2. (C) Extracted ion chromatograms (EICs) showing inhibitory activity (determined by SILAC ratios, SRs) of VX-11e and BVD-523 against native ERK1 and ERK2 in A549 proteomes treated with vehicle (light) or compounds (heavy; 10 and 100 nM). (D) Dose–response curves from SILAC analyses to estimate potency of VX-11e and BVD-523 in A549 proteomes: VX-11e: ERK1 – IC50 = 17 nM (95% confidence interval (CI) of 12–24 nM), ERK2 – IC50 = 15 nM (95% CI of 10–23 nM); BVD-523: ERK1 – IC50 = 15 nM (95% CI of 11–20 nM), ERK2 – IC50 = 12 nM (95% CI of 11–15 nM).

Fig. 4