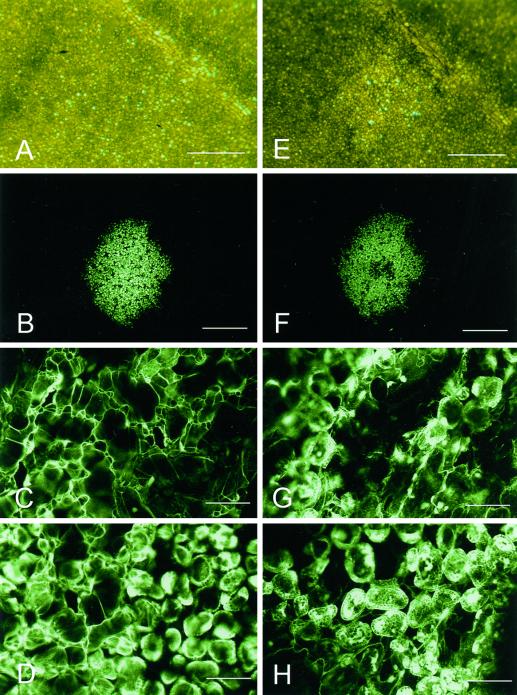
Figure 1.
TMV infection foci following induction of the HR. Images of the same TMV infection focus observed at 11 hpt (A–D) and 15 hpt (E–H) viewed using either transmitted light under the stereomicroscope (A and E) or blue light under the CLSM (B–D and F–H). The images in A through D show the infection focus prior to visible cell collapse, whereas images in E through H show the infection focus following the development of visible symptoms. The CLSM images in C and G are focused on the upper leaf epidermis. Images in D and H are focused on the palisade mesophyll. Scale bars = 1 mm (A, B, E, and F), = 0.1 mm (C, D, G, and H).

