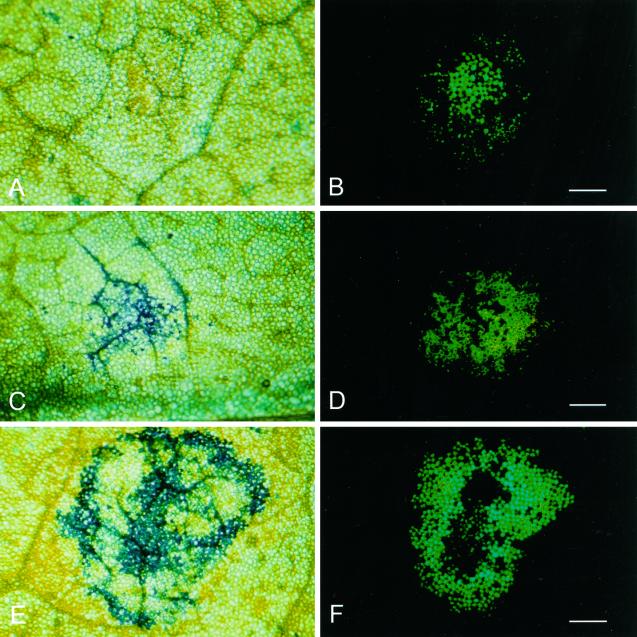
Figure 3.
Cell death prior to the onset of visible tissue collapse. Stereomicroscope bright field (A, C, and E) and fluorescence (B, D, and F) micrographs showing TMV.GFP infection foci after staining with Evans blue. A and B, Eight hpt, scale bar = 1 cm (B); C and D, 9 hpt, scale bar = 0.5 cm (D); E and F, 14 hpt, scale bar = 0.5 cm (F).

