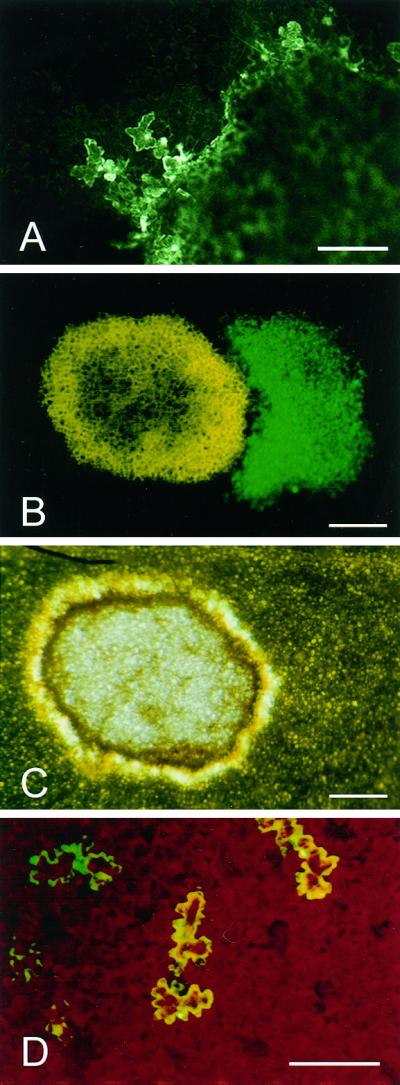
Figure 7.

Survival of TMV-infected cells at the margin of necrotic lesions. A, CLSM image of TMV.GFP-infected epidermal cells adjacent to a collapsed necrotic lesion (right-hand side of image) at 52 hpt. B and C, Fluorescence and bright field images, respectively, of a necrotic lesion after a 65-h incubation at 20°C followed by a 96-h incubation at 34°C. The necrotic lesion shown in C appears as yellow autofluoresence in B and TMV.GFP-infected tissue appears green. D, Stereomicroscope fluorescence image showing individual epidermal cells infected with the cell-to-cell movement-deficient mutant, TMV.GFPΔMP, at 48 hpt. Scale bars = 0.2 mm (A and D) and 0.5 mm (B and C).
