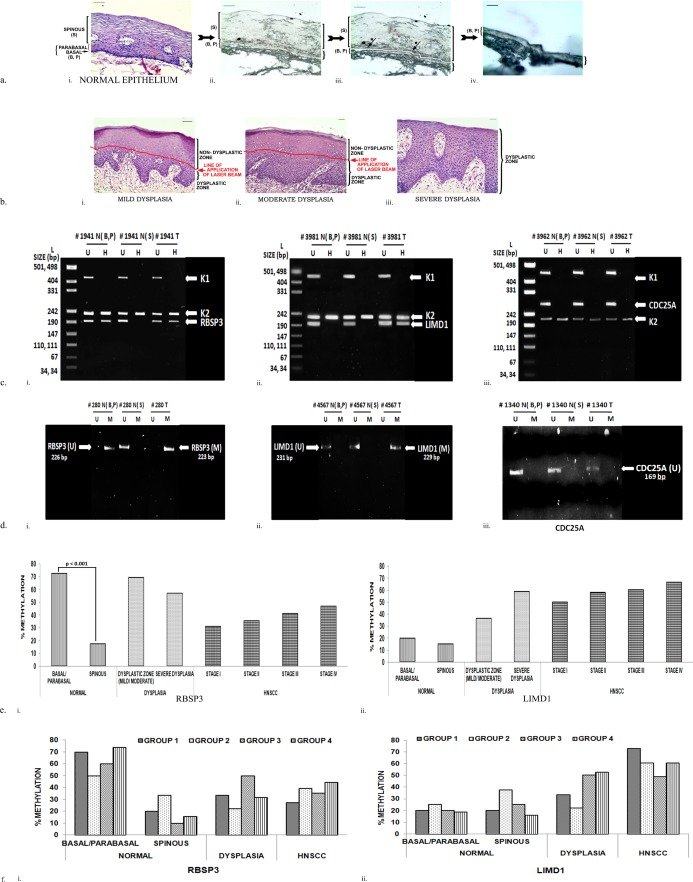
Fig 2. Promoter methylation analysis.
Promoter methylation of the genes in normal epithelium (basal/ parabasal and spinous layers), dysplastic zone of epithelium and HNSCC. U: Unmethylated; M: Methylated; N: Normal; T: Tumor; B: Basal layer; P: Parabasal layer; S: Spinous layers; L: pUC19/ HpaII molecular weight ladder. a. Representative images depicting step- wise separation of basal/parabasal and spinous layers in normal epithelium.i. Hematoxylin and eosin stained parallel normal section. ii. Unstained parallel section. iii. Laser line (arrow star) demarcating basal/ parabasal and spinous layers. iv. Remaining basal/ parabasal layers after separation of the spinous layers. b. Representative hematoxylin and eosin stained sections for separation of dysplastic and non- dysplastic zone in mild/ moderate and severe dysplasia. i. Mild dysplasia; ii. Moderate dysplasia; iii. Severe dysplasia. Red line represents the line of application of laser beam for separating dysplastic and non- dysplastic zones. c. Representation agarose gel image showing methylation by Methylation Specific Restriction Analysis (MSRA). U: Undigested; H: HpaII digested. d. Representation agarose gel image showing methylation by Methylation Specific PCR (MSP). U: Unmethylated; M: Methylated. e. Histograms depicting percentage of methylation obtained for i. RBSP3; ii. LIMD1. f. Histograms depicting percentage of methylation in etiological groups in i. RBSP3; ii. LIMD1. p value (Fisher’s exact) represents the level of significance during univariate comparison. # Represents sample number; B: Basal; P: Parabasal: S: Spinous: T: Tumor; N: Normal. Group 1: HPV-TOB-; Group 2: HPV+TOB-; Group 3: HPV-TOB+; Group 3: HPV+TOB+.

