
Fig 5. Correlation between the expressions of the inflammasome components in GALT with the CD4+ T-cell count and viral load.
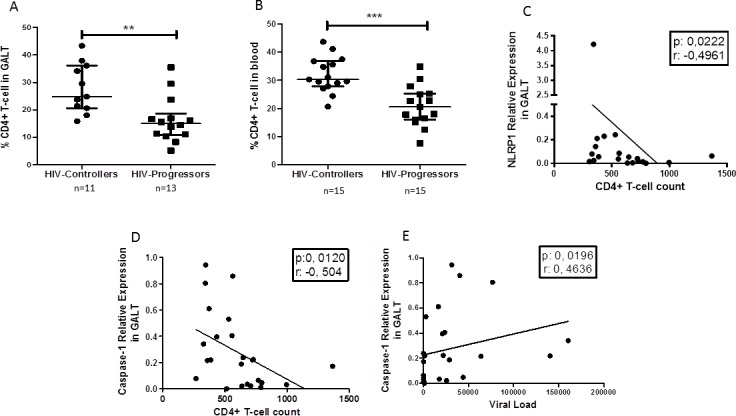
Higher frequency of CD4+-T cells in GALT (A) and peripheral blood (B) in HIV-controllers compared to HIV-progressors. The relative expression of NLRP1 in GALT was negatively correlated with the CD4+ T-cell in peripheral blood (C). Equally, the relative expression of caspase-1 was negatively correlated with the CD4+ T cells in peripheral blood (D) and positively with the viral load (E). Statistical comparison between groups was performed using a Mann-Whitney U test with a confidence level of 95%. Significant differences are indicated at the top of the figure (**p <0.01) (***p<0,001). The correlations were performed with a Spearman test. The r value and the p-value of the correlations are indicated at the top of each figure; a p-value less than 0.05 was considered as a significant correlation.